The Fornax Science Console offers a lightly customized version of JupyterLab that many Python users will find familiar. We refer readers to the JupyterLab documentation for details of the interface. Here we define the major components of this interface that we will refer to throughout the User Guide.
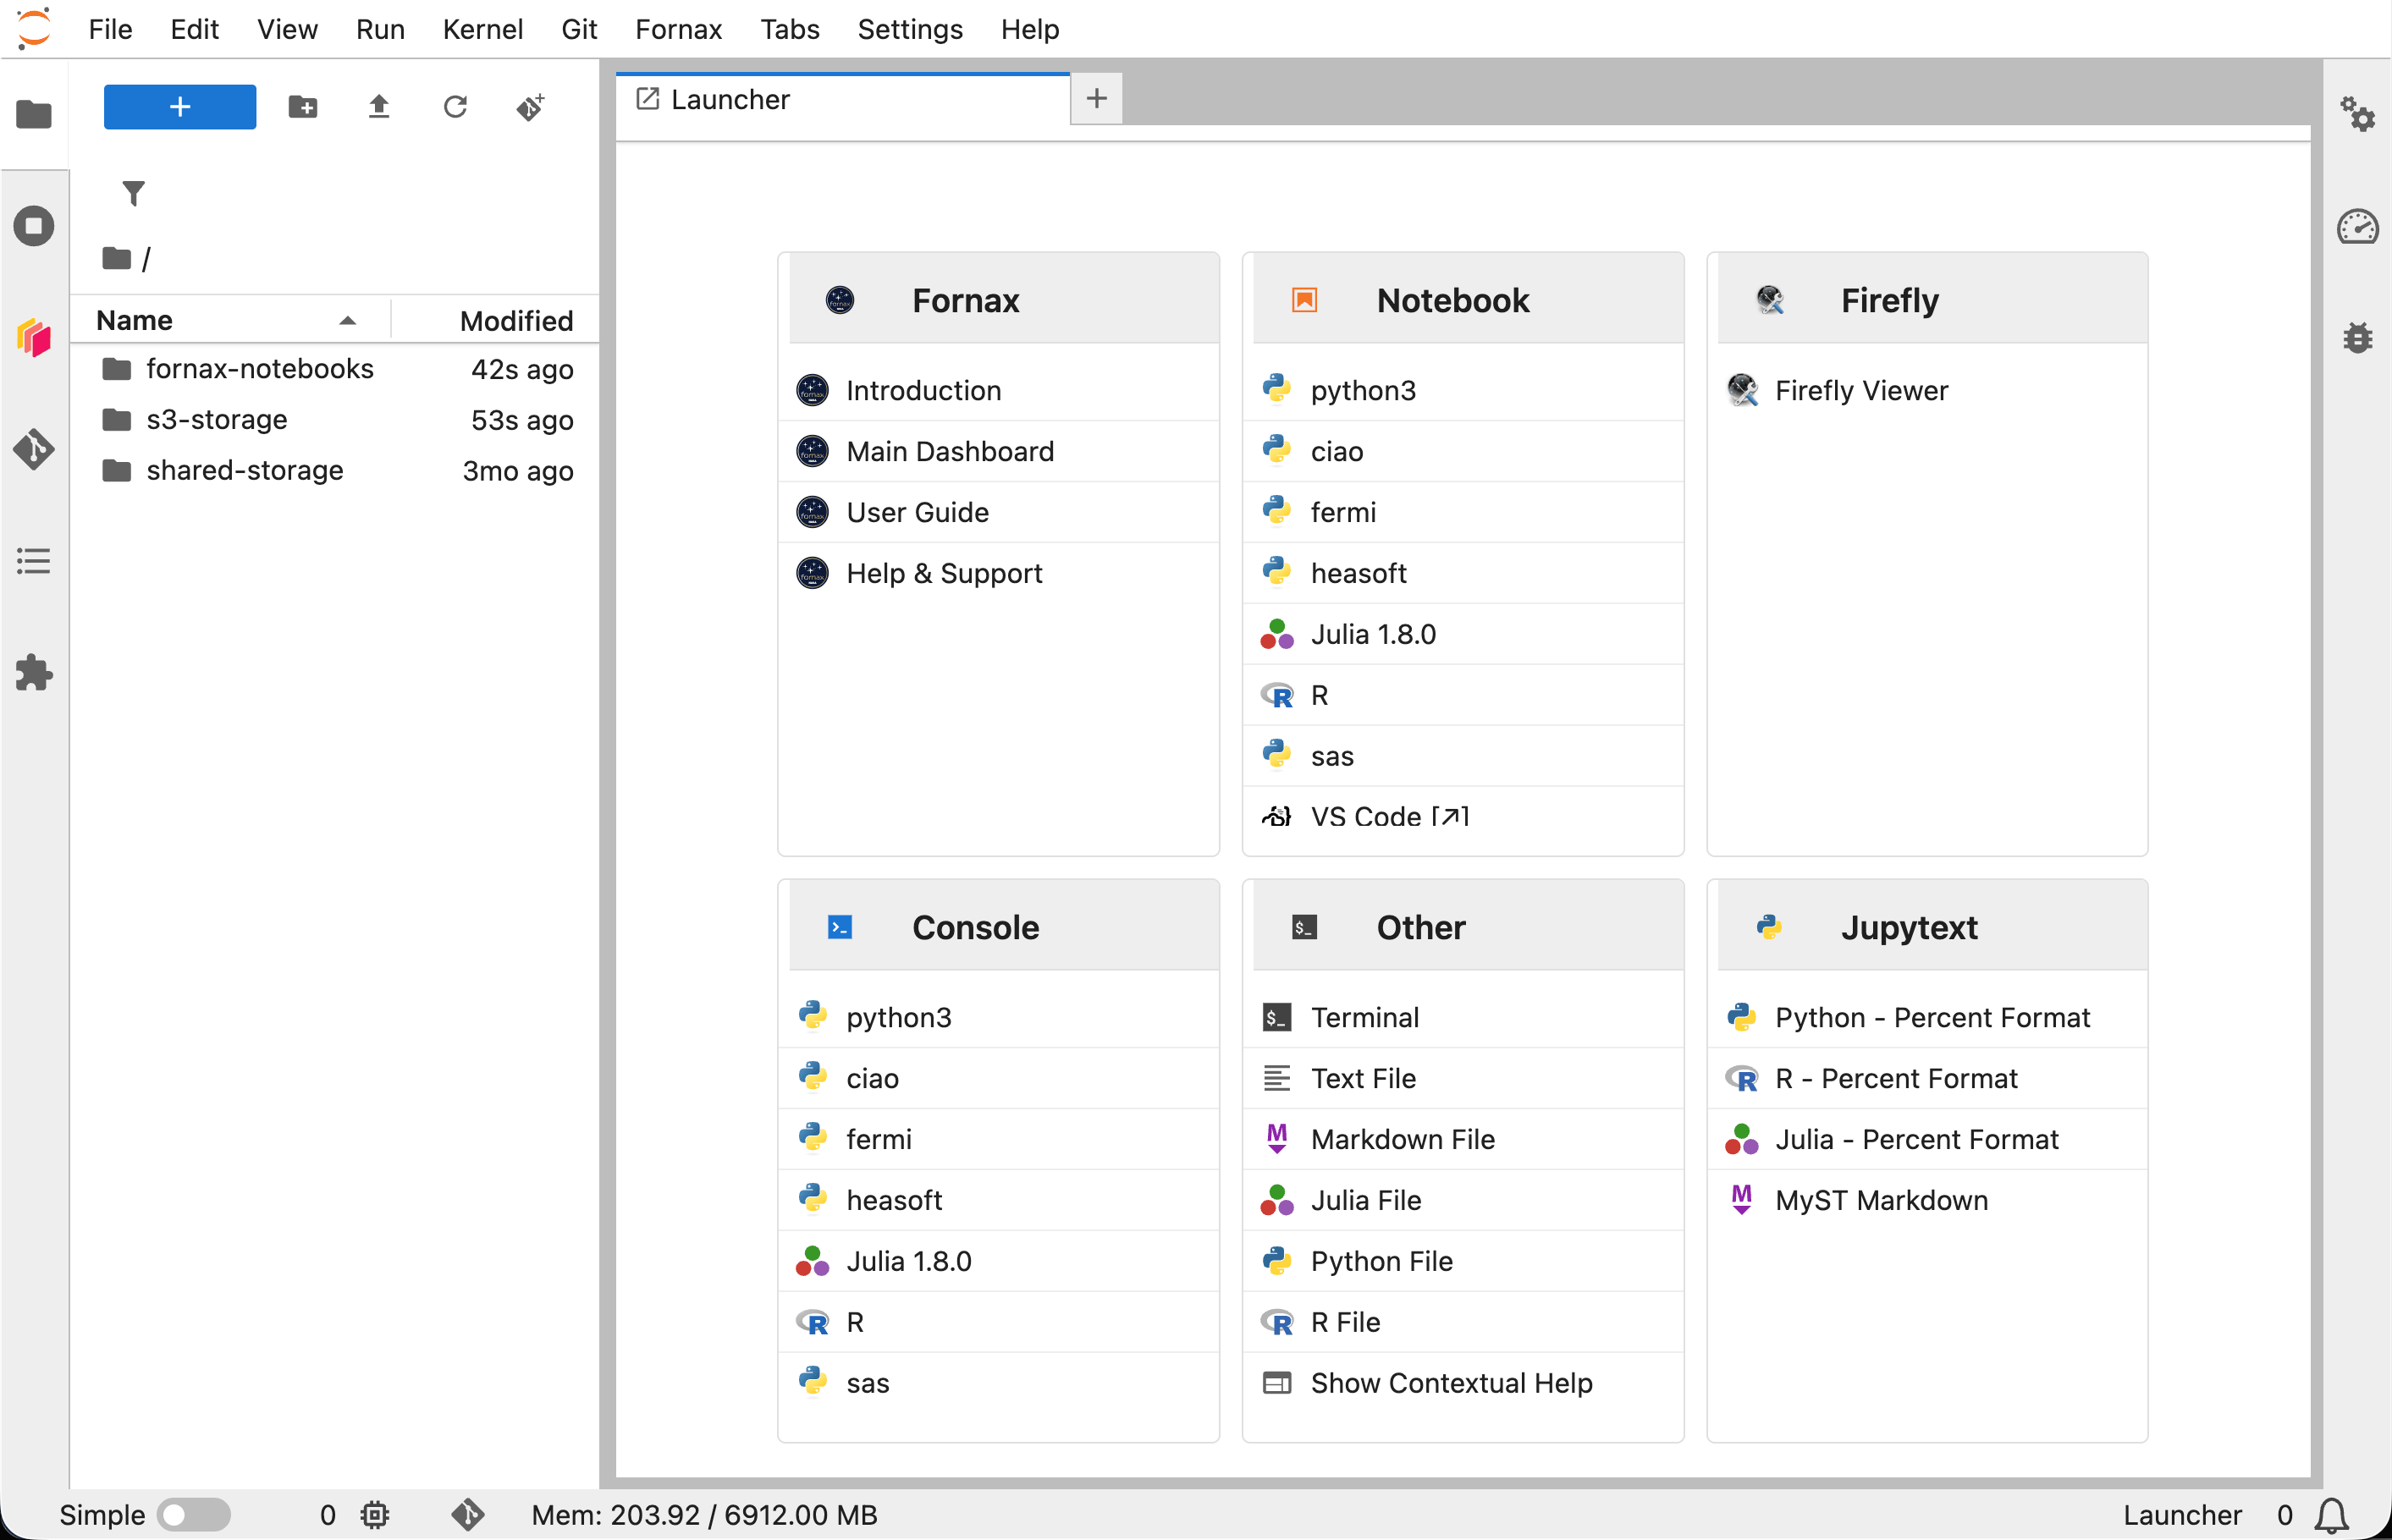
JupyterLab deployed in the Fornax Science Console
Main Work Area
The main work area in JupyterLab is the central space where you open and interact with documents, notebooks, terminals, consoles, and other panels. It supports multi-document, tabbed, and split-pane layouts, allowing you to work with multiple files side by side. You can drag and arrange tabs freely, view code, outputs, data files, or terminals in one unified interface, and seamlessly switch between tasks—making it a flexible environment for data analysis, coding, and exploration.
Launcher
The Launcher panel provides clickable tiles for quickly starting new tools, such as notebooks and terminals. This panel may be open by default when a session starts and a new one can be opened at any time by clicking the plus sign to the right of open tabs. Many of the tools are standard for JupyterLab and more information about them can be found at the documentation linked above. Below we discuss some of the other tools available via the Launcher.
- Fornax
- The Fornax section contains links to the Dashboard, documentation (this website), and the Fornax Community Forum and Helpdesk.
- Notebook and Console
- These sections list a subset of the Pre-installed Environments. Clicking on one will open a Jupyter Notebook or Jupyter Console connected to the corresponding kernel. To connect to any other environment, see Activate an Environment.
- VS Code
- VS Code (under Notebook) will open a new window where you can work in a web-based integrated development environment (IDE).
It is powered by code-server which runs Visual Studio Code - Open Source in a remote environment.
See those links for more information.
Note: Microsoft-specific customizations like GitHub Copilot are only available in Microsoft’s desktop version of VS Code and so cannot be accessed here.
Note also that any
code-serverextensions you install are stored in your home directory, so they persist between sessions. - Firefly
- Firefly is a modern web-based GUI for accessing and exploring astronomical data with advanced data visualization capabilities.
This extension (jupyter
_firefly _extensions) allows users to visualize interlinked images, catalogs, charts, and more from their notebooks in a Firefly viewer embedded within JupyterLab. Check out Firefly’s Python API and full capabilities at firefly-client documentation and the example notebooks demonstrating them at IRSA tutorials. - Terminal
- Terminal provides a command line, which allows users to run shell commands, Emacs, vi, Python, etc.
Menu Bar (Topmost horizontal menu)
This contains dropdown menus like File, Edit, etc., and the Fornax menu, which includes:
Useful links to the Fornax main dashboard, the documentation and community forum.
Shutdown Serveris a quick link to the JupyterHub control panel that can used to shut down the current notebook session.Keep-aliveis used to request the current session not to be terminated. See JupyterLab Session Information.Release Notesshows the changes in the software environment.
Left Sidebar
The left sidebar is a vertical strip of icons, each representing a tool or extension that will open up in the left column of the interface.
- File Browser (📁)
The File Browser lets you navigate and open files and folders. Double-click a file or .ipynb notebook to open it in the main area. Opening .md files as notebooks should be done by right clicking on the file → “Open With” → “Notebook” so that they display in the expected format with cells of runnable code.
This includes the Launcher (blue plus sign; see above for more information), New Folder (folder symbol with plus sign), and Upload Files (up arrow) icons.
- Running Terminals and Kernels
Running Terminals and Kernels monitors and manages active processes in your JupyterLab environment, such as running notebooks, terminals, and associated kernels.
- Dask
Dask is a Python library for parallel and distributed computing. It is available by default in the main Python kernel
python3, and can be used from a script or a notebook. Additionally, the Fornax Science Console includes the Dask JupyterLab Extension (dask-labextension) which is a visual dashboard that can be used to manage clusters and profile parallel code.A cluster can be started from either the dask-labextension or a notebook:
Using the dask-labextension: To start a cluster, click the dask-labextension icon (
 ) in the left sidebar and then click
 +NEW. A dashboard with yellow buttons will show up that link to different profiling charts. Information about the new cluster are displayed at the bottom of that pane, including code that helps you connect to that cluster from a notebook (drag the<>icon into a notebook cell to copy the code).In a notebook, run a code like the following:
from dask.distributed import Client
client = Client(threads_per_worker=4, n_workers=2, memory_limit='4GB')
client
This will print information about the cluster, including the link to the dashboard of the form:
/jupyter/user/<USERNAME>/proxy/<PORT>/status. Clicking the link will open a new browser window to the dashboard. You can also connect to the dashboard by copying and posting that link in the dask-labextension window. Note: You may need to installbokehin the same kernel as your notebook in order to display the profiling charts.
There are a few things to note when using Dask in the Fornax Science Console:
dask[distributed]is pre-installed in the default kernelpython3. If you plan to use it with a different kernel, you’ll need to install it there withpip install dask[distributed].Currently, Fornax only supports clusters running in the same instance. We plan to support launching instances in a Kubernetes cluster in the near future.
- Git
- This extension integrates Git version control into the JupyterLab interface, enabling you to stage, commit, push, and pull notebook and code changes without leaving the environment. It provides visual diffs, branch management, and history browsing, making collaborative development and reproducibility seamless. See How do I use Git from Fornax? for more information about setup and authentication, and jupyterlab-git for more information about the extension.
- Table of Contents
- Automatically generates a sidebar outline of all headings in your notebook or document, allowing you to quickly navigate between sections.
- Extensions Manager
- Shows installed extensions and lets you manage them.
Right Toolbar
The right toolbar is a vertical strip of icons, each representing a tool or panel that will open up in the right column of the interface.
- Property Inspector
The Property Inspector shows metadata, configuration options, or properties for the currently selected item in the JupyterLab interface.
- Kernel Usage
In JupyterLab, the kernel is the computational engine that executes your code. It is connected to an environment with installed software. When you open a notebook or console in JupyterLab, it connects to a kernel that runs the code you write, keeps track of variables, and returns output (such as plots, results, or errors) back to the interface.
The Kernel Usage tool monitors resources (such as CPU and memory) being used by your Jupyter kernel.
- Debugger
The Debugger allows you to step through your code to identify bugs, understand the flow of execution, and troubleshoot issues in real-time by providing features like breakpoints, variable inspection, and call stacks.
JupyterLab Session Information
To allow for efficient use of resources, idle sessions will be stopped (or culled). Fornax has the following guidelines for session culling:
All sessions have a hard upper limit of 48 hours.
If a session contains running jobs with CPU activity, it will not be culled.
A session is stopped after 15 minutes of no activity.
The user can override the 15 min no-activity limit by using the Keep-Alive feature under the Fornax menu.
Start a session: You can request the session to stay alive by selecting:
Fornax → Keep-alive → Start Keep-alive Session. Pick a time using the abbreviated notation such as ‘2d’ for two days, ‘3h45m’ for 3 hours and 45 minutes, or the time in seconds as an integer.Stop a session: end a previously started session by
Fornax → Keep-alive → Start Keep-alive Session.The time remaining in the currently requested session is shown in the status bar at the bottom left, e.g. ‘Keepalive: 35m’.