The Fornax Science Console is free for users. NASA provides each user with a yearly allotment of credits to spend on compute and other resources. When users log in, they will see a Dashboard similar to the one below that details their resource and credit usage.
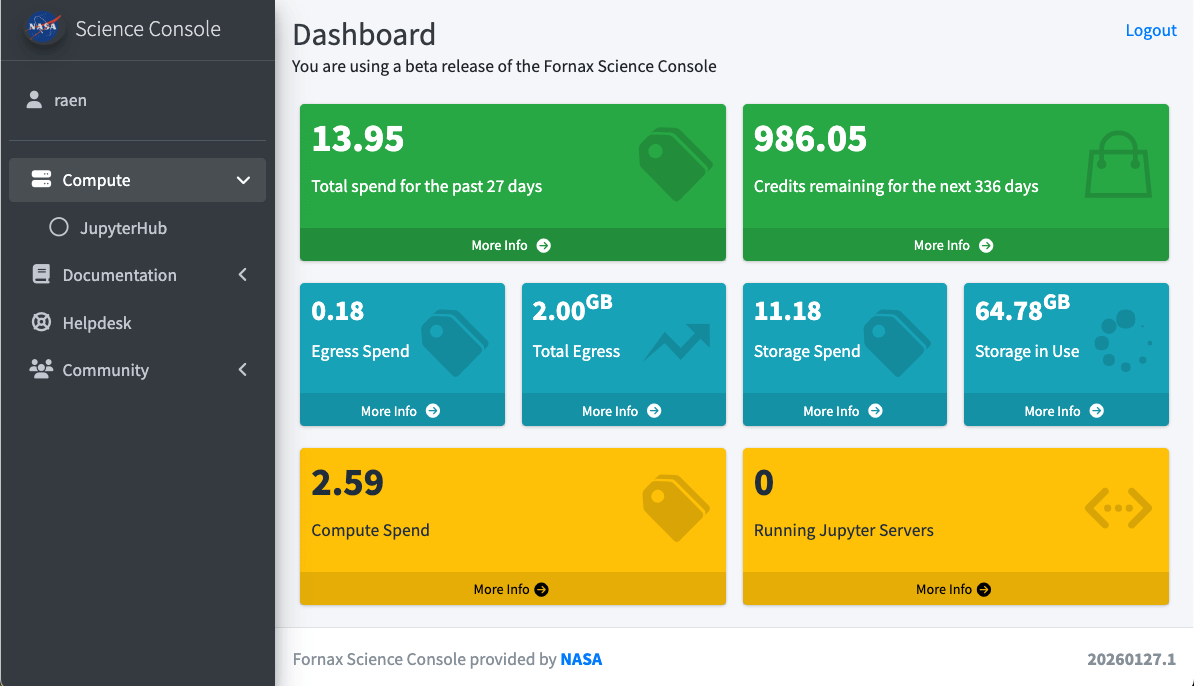
The Fornax Science Console Dashboard
- Total Spend
- Total Spend tracks the total number of credits spent on egress, storage, and compute so far this year.
- Credits Remaining
- Credits Remaining tracks the total number of credits left to be spent on any combination of egress, storage, and compute for the rest of this year.
- Egress Spend
- Egress Spend tracks total number of credits spent on egress so far this year. Egress refers to data that is transferred out of a cloud provider’s system to somewhere else, like your local computer or another cloud.
- Total Egress
- Total Egress tracks the total volume of data (in GB) that has been transferred out of the platform so far this year.
- Storage Spend
- Storage Spend tracks the total number of credits spent on storage so far this year. This includes all private storage areas, such as the home directory and S3 (based on amount used), and temporary storage (based on amount allocated).
- Storage in Use
- Storage in Use tracks the volume of storage in GB that you are currently using, including your home directory and S3 storage space.
- Compute Spend
- Compute Spend tracks the total number of credits spent on server sessions so far this year.
- Running Jupyter Servers
- Running Jupyter Servers shows 0 if you are not running a compute environment, or 1 if you are. Note there is a delay in this value of about 1-2 minutes, so if you shut down your server, you will have to wait a bit before this number shows the update.
To see changes, you can reload the Dashboard at any time without affecting a server you may have running, but note that there may be a delay of up to a few minutes before recent usage is reflected.